Assists Breakdown
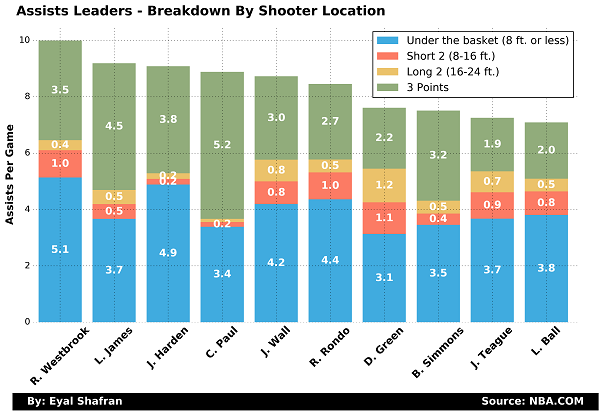
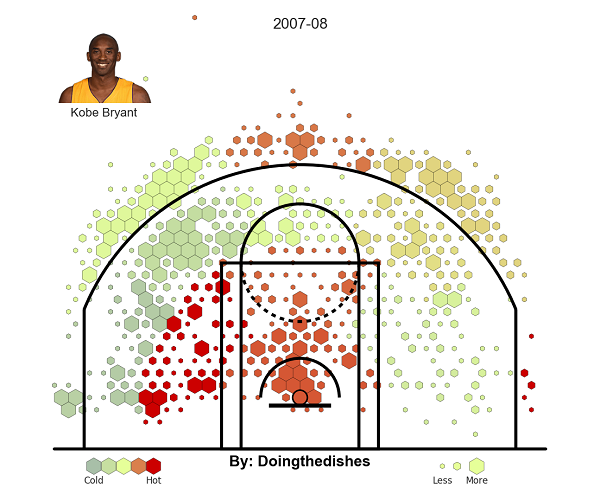
In this post I will plot a Grantland style shot chart for every MVP in the last 20 years.
more ...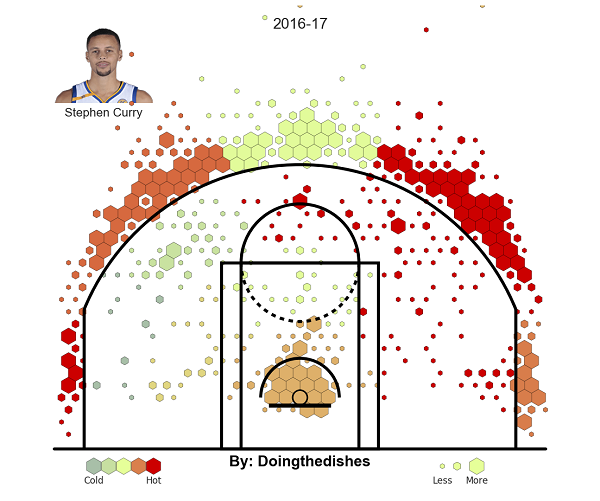
In this post I will show how to make with Python. The basic idea of the shot chart is: Shots are represented by hexagons. More shots = larger hexagon and vice versa. Color of the hexagon represents the FG % relative to the league average.
more ...