Four Factors
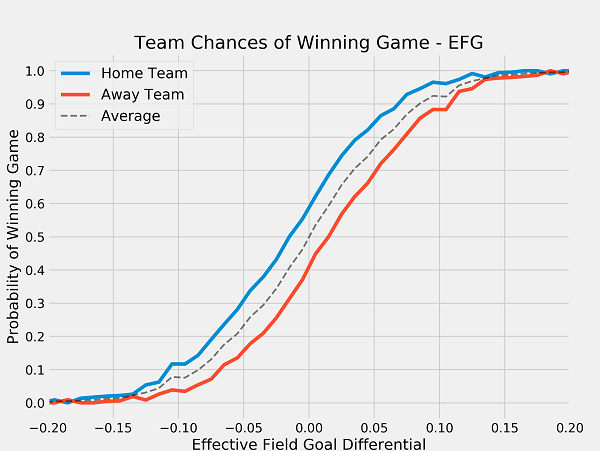
In this post I'm going to explore Dean Oliver's Four Factors, compute the weight of each factor based on linear regression and see how those factors are influenced by home court advantage.
more ... In this post I'm going to explore Dean Oliver's Four Factors, compute the weight of each factor based on linear regression and see how those factors are influenced by home court advantage.
more ...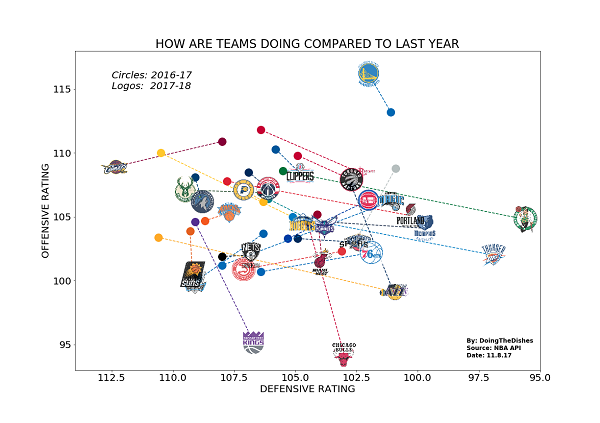
In this post I'm going to show how to create a scatter plot with team logos. As an example, I plot the team's offensive and defensive rating.
more ...In this post I'm going to scrape www.basketball-reference.com in order to get some generic information for every player that played in the NBA. I'm also going to get population data per state from wikipedia.
more ...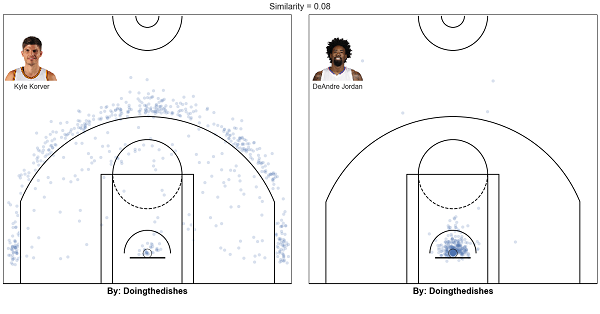
In this post I will compare different NBA players based on their shot selection and cluster them into groups. These new groups can be compared to the assigned position of players to check for correlation.
more ...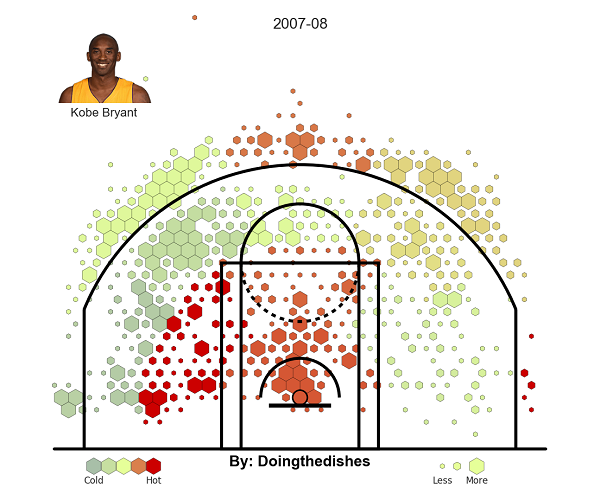
In this post I will plot a Grantland style shot chart for every MVP in the last 20 years.
more ...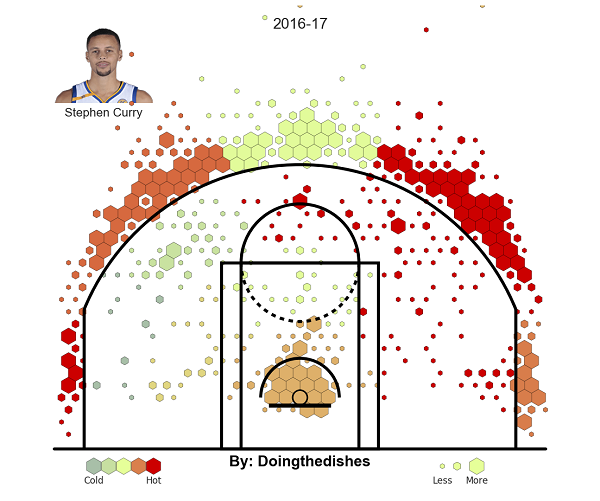
In this post I will show how to make with Python. The basic idea of the shot chart is: Shots are represented by hexagons. More shots = larger hexagon and vice versa. Color of the hexagon represents the FG % relative to the league average.
more ...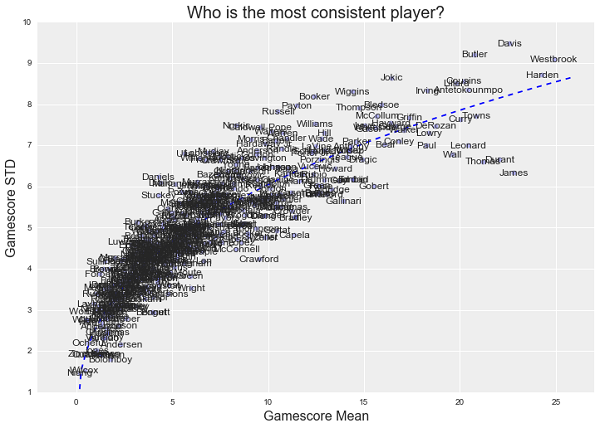
In this post I will try to figure out who is the most consistent player during the 2016-17 season using python and the NBA api.
more ...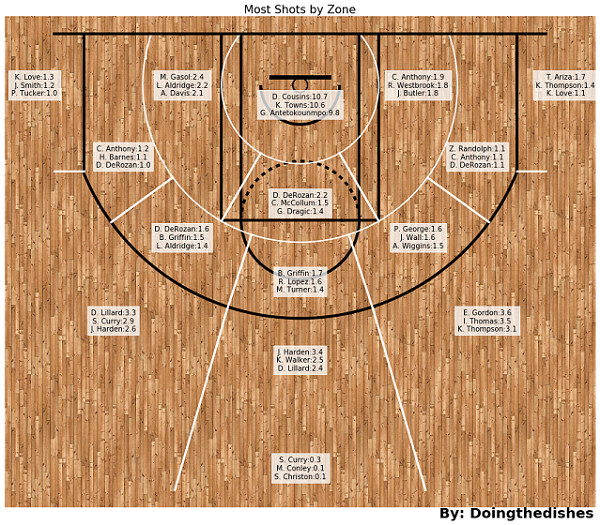
In this post I will use the NBA API to access shot chart data and use it to make some cool plots based on the shot zone information which is available in the raw data.
more ...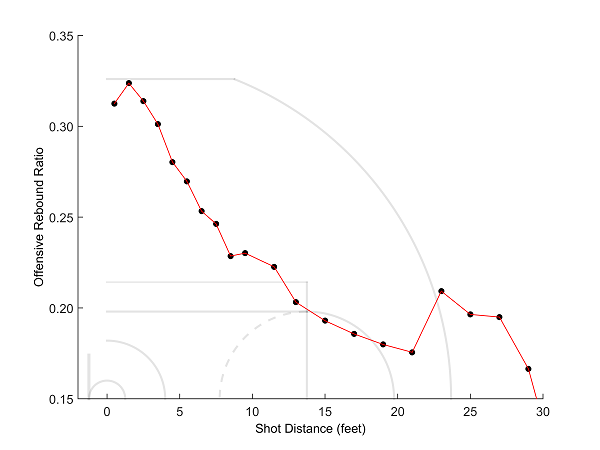
In this post I will explore offesive rebounds and their dependency on shot distance for various situations.
more ...